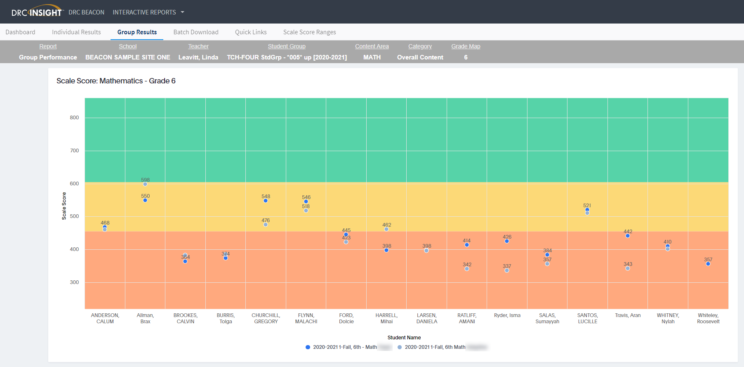
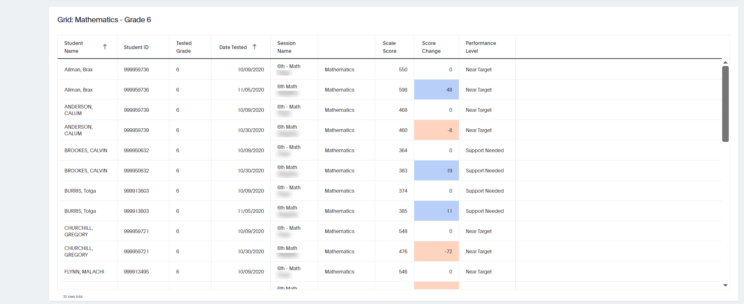
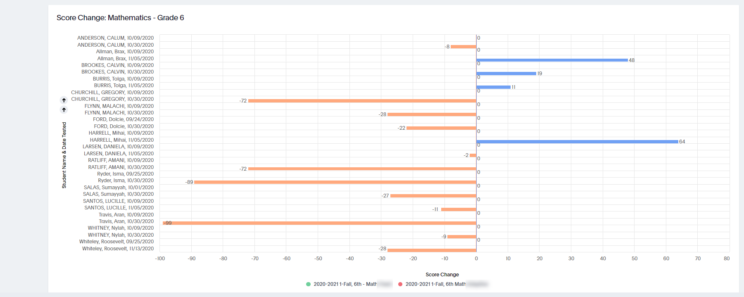
Group Performance
- Displays scores and identifying information for a specified Student Group
- Includes results for multiple test sessions
- Different charts to provide a visual representation of Student scores and the change in scores between test events over time
- Users (All users can do this.) can select a Grade option to view the Performance Level cut points for different Grade/Content/Category combinations
- Includes an option to view each content area (Math/ELA) separately along with a predefined view for Reporting Category and a drill-down to a Summarized view of Reporting Categories to assist user on identifying which Reporting Categories to pay attention to.
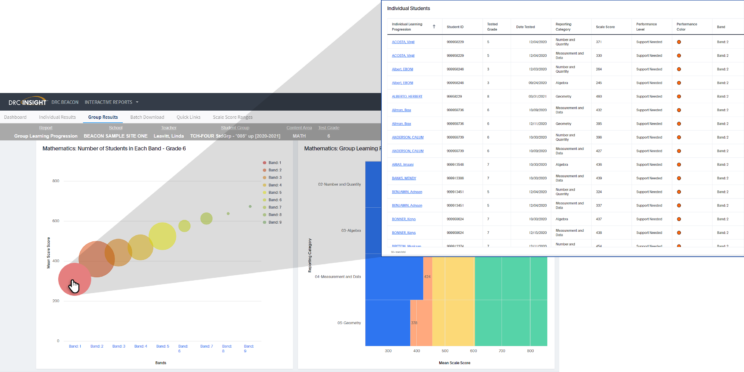
Group Learning Progression
- Displays scores and identifying information for a specified Student Group
- Includes results for a single test session
- Student’s names link to the Individual Learning Progression for the student
- Displays distribution of students within each band and the average scale score for the Student Group in each of the reporting categories.
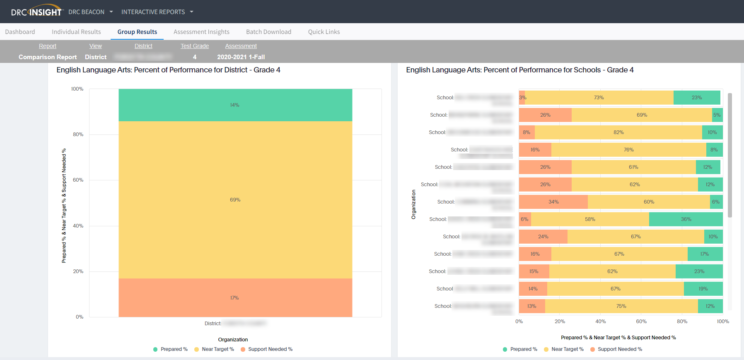
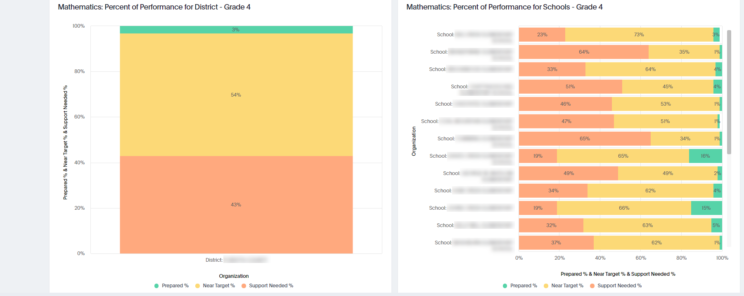
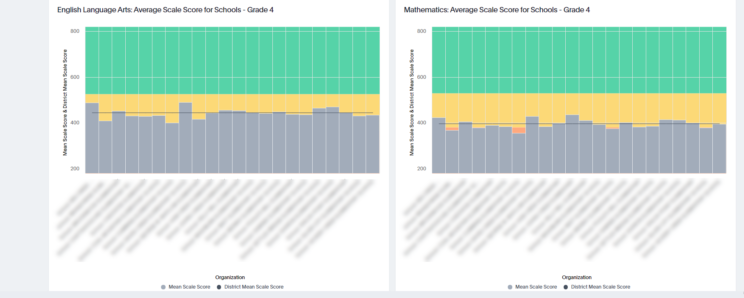
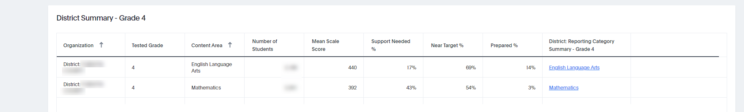
Comparison Report
- Summary level information for a single test event
- Different charts to provide a visual representation of percent of Students within each Performance Level and comparisons to mean scores at different levels
- Includes predefined views for District, School, and Class and sections for each Content Area tested
- Users (Teachers/School/District) can drill down to underlying data from the charts and link to additional views for each Reporting Category
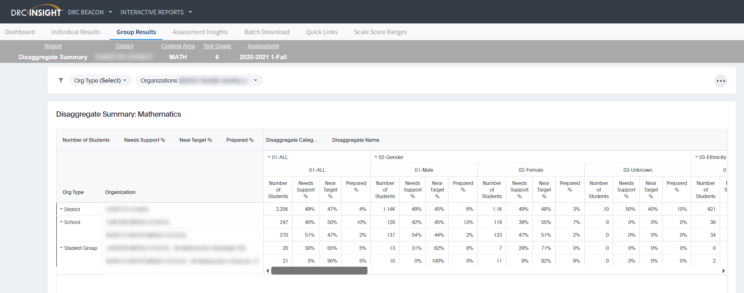
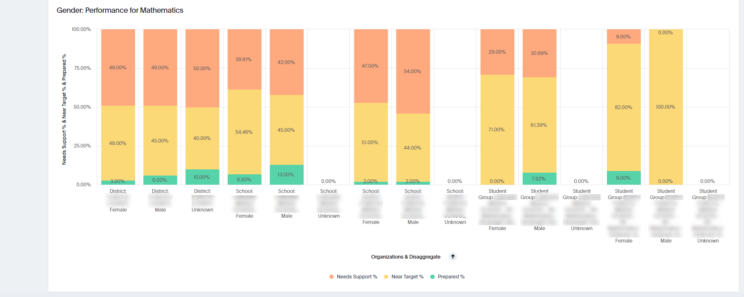
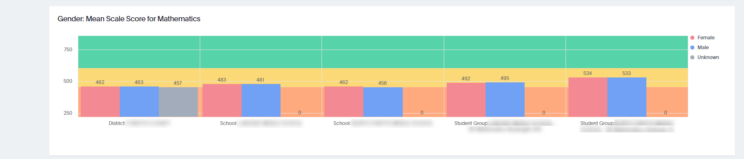
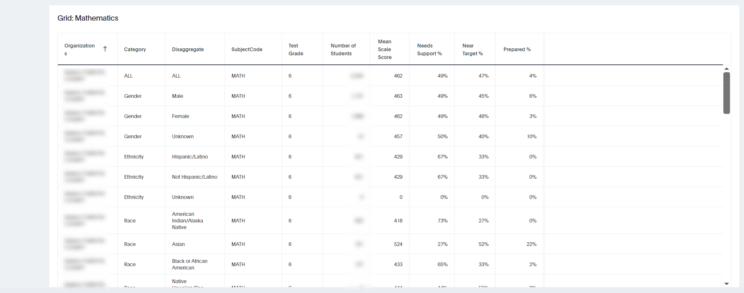
Disaggregate Summary
- Summary level information for a single test event
- Different charts to provide a visual representation of percent of Students within a demographic group across each Performance Level along with comparisons to mean scores at different levels
- Includes sections for each Content Area tested
- Users (Teachers/School/District) can drill down to underlying data from the charts