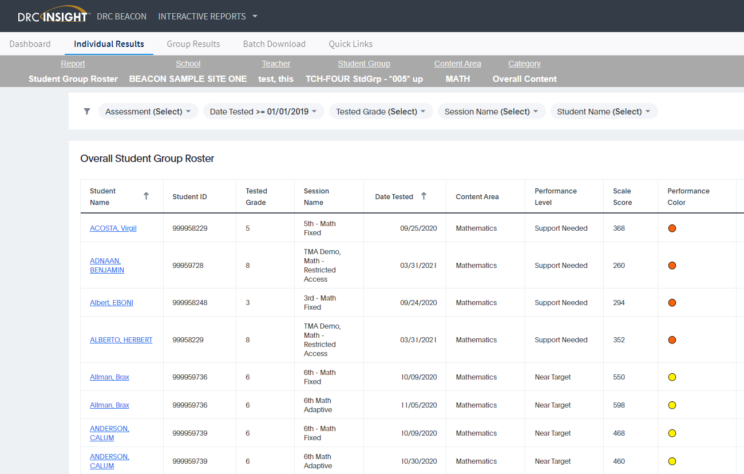
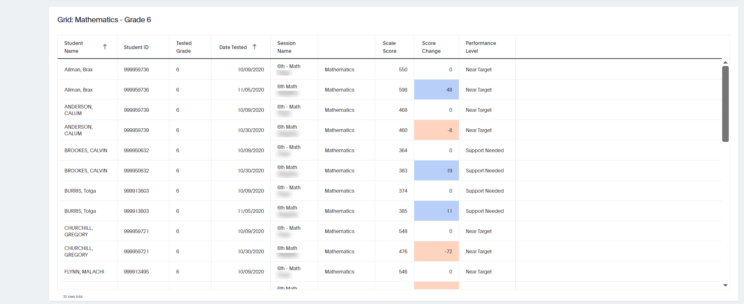
Student Group Roster
- List of students, some identifying elements (e.g. Student ID or DOB), and corresponding test and score information in a tabular view
- Includes results from a single test session
- Allows User (Teacher) to quickly sort Student results in a specific sequence or filter down to a subset of Students (e.g. certain performance levels or scale score ranges)
- Provides one-click access to Individual Student Reports (ISR) for viewing, download, and print. ONLY on the “All” / Overall views since the ISR will only be for complete and composite tests not individual testlets.
- Includes an option to view each content area (Math/ELA) separately or combined, along with 3 predefined views for Overall Content; Subject Area; and Reporting Category
- Choosing the Reporting Category or Subject Area view will populate another filter that allows users to select one Reporting Category/Subject Area or to go to a view with all. NOTE: when selecting the “All” view will only show Composite/Complete(Overall) tests.
- Performance Color provides a quick visual cue for your on-screen analysis
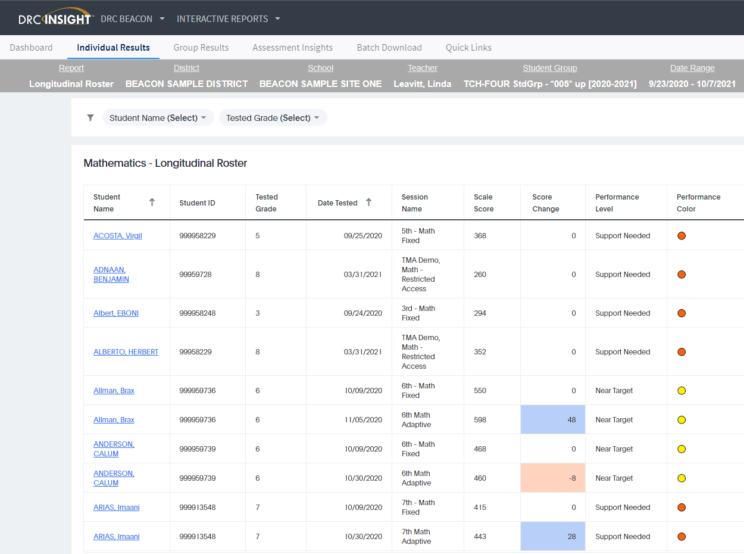
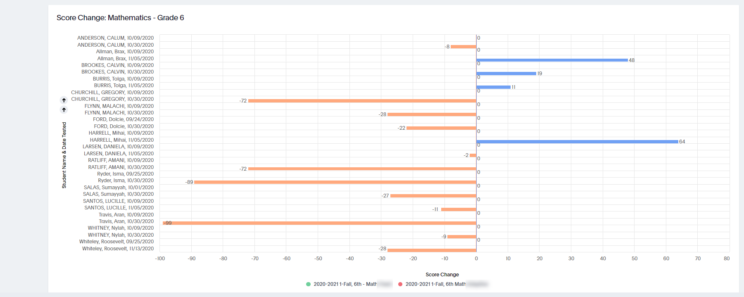
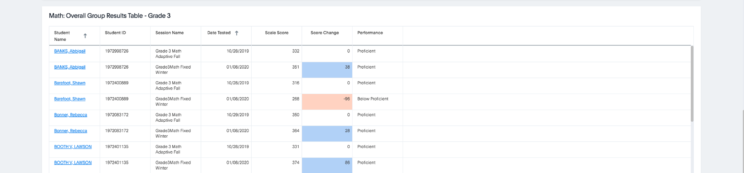
Longitudinal Roster
- List of students, some identifying elements (e.g. Student ID or DOB), and corresponding test and score information in a tabular view
- Includes results from multiple test sessions
- Allows User (Teacher) to quickly identify the change (growth or regression) in score/performance between different instructional and testing periods
- Users can sort Student results in a specific sequence or filter down to a subset of Students (e.g. certain performance levels or scale score ranges)
- Provides one-click access to Individual Student Reports (ISR) for viewing, download, and print
- Includes an option to view each content (Math/ELA) area separately or combined, and to specify a date range for relevant test sessions
- Performance Color provides a quick visual cue for your on-screen analysis
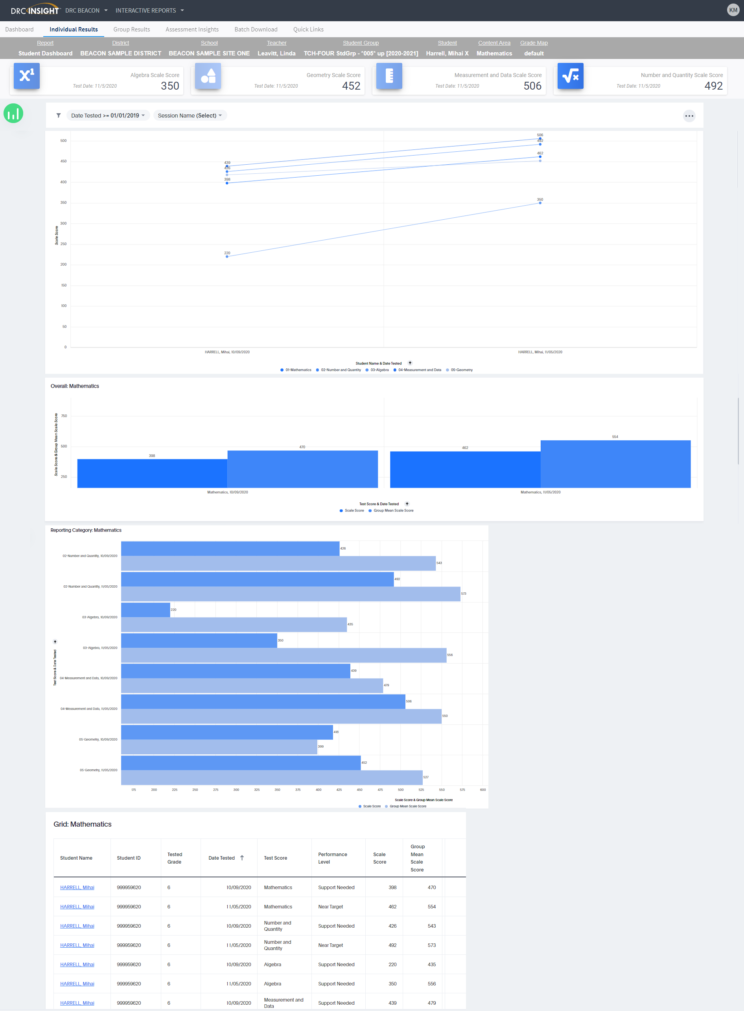
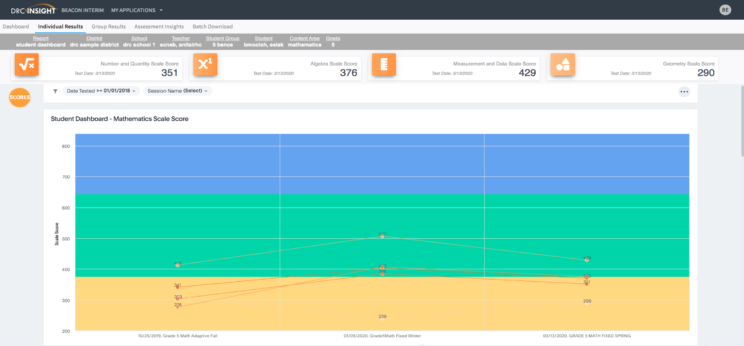
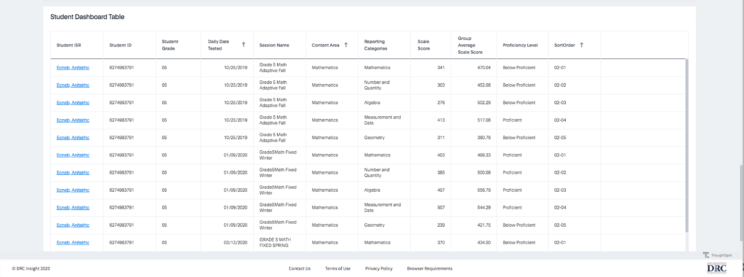
Student Dashboard
- Dashboard of various measures and context related to Student testing results
- Includes all test results for a single Student at a time
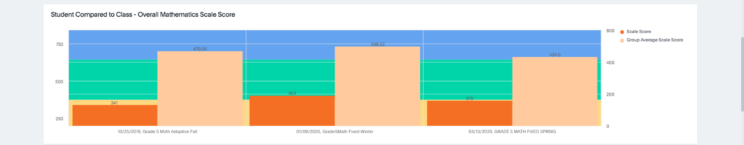
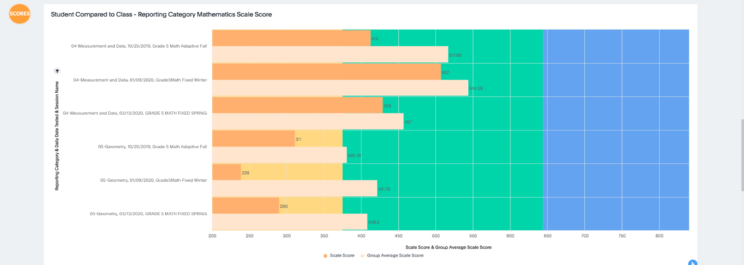
- Specific views or information provided: Headline scores from most recent test event (by reporting category (Math) and Subject Area (ELA)); scale scores for all tests over time (by reporting category, Overall Content, and Subject Area(ELA)); Comparisons to mean scores for the Student Group the student was apart of for the session.
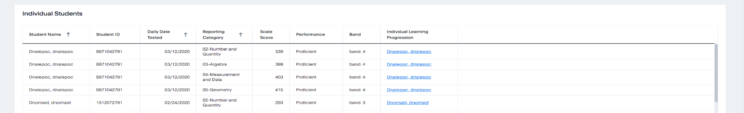
Individual Learning Progression
- Displays scores and identifying information for a single Student
- Includes results for a single test session
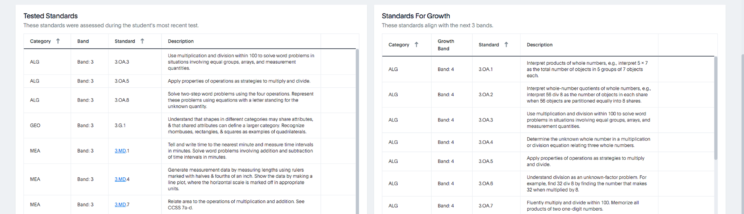
- Features tabular views of Student scores within reach Reporting Category, the corresponding Band from the Learning Progression, and the associated Standards and Descriptions
- Users (Teachers) can see the Band and Standards that align with the Student’s scores (“Tested Standards”) along with the Standards associated with the next Band(s) in the progression (“Standards for Growth”)
- Performance Color provides a quick visual cue for your on-screen analysis
- Standards hyperlink to Educational Instructional Strategies
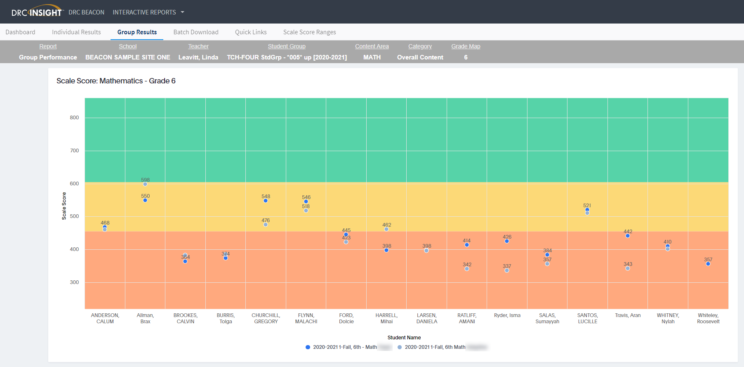
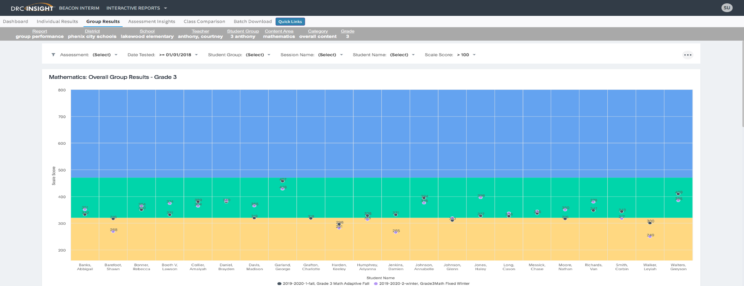
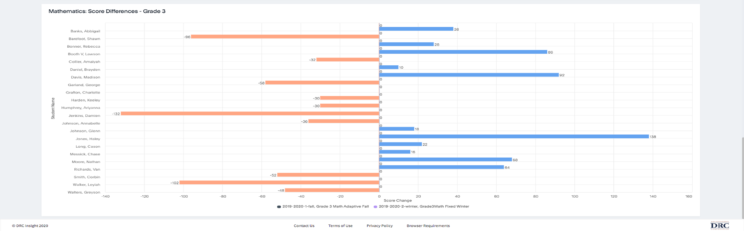
Group Performance
- Displays scores and identifying information for a specified Student Group
- Includes results for multiple test sessions
- Different charts to provide a visual representation of Student scores and the change in scores between test events over time
- Users (All users can do this.) can select a Grade option to view the Performance Level cut points for different Grade/Content/Category combinations
- Includes an option to view each content area (Math/ELA) separately along with a predefined view for Reporting Category and a drill-down to a Summarized view of Reporting Categories to assist user on identifying which Reporting Categories to pay attention to.
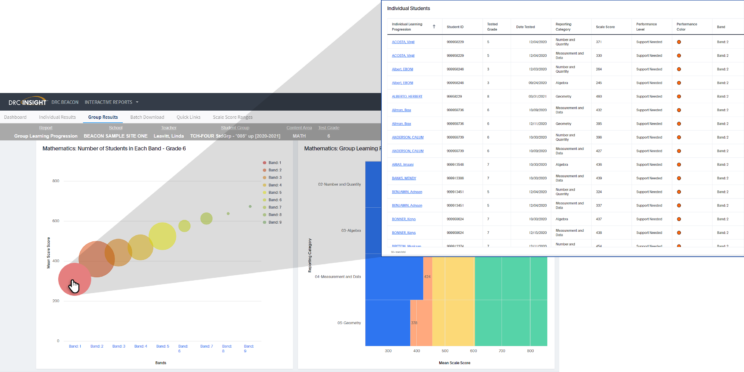
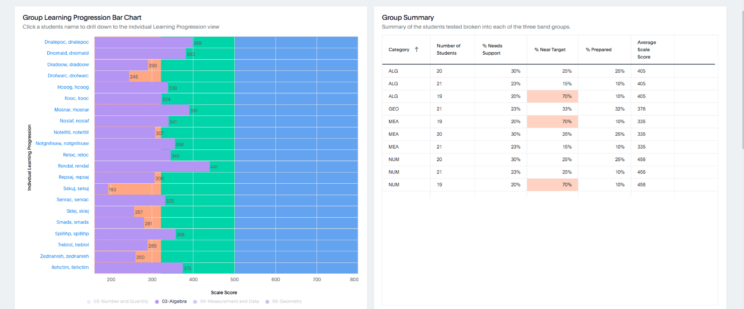
Group Learning Progression
- Displays scores and identifying information for a specified Student Group
- Includes results for a single test session
- Student’s names link to the Individual Learning Progression for the student
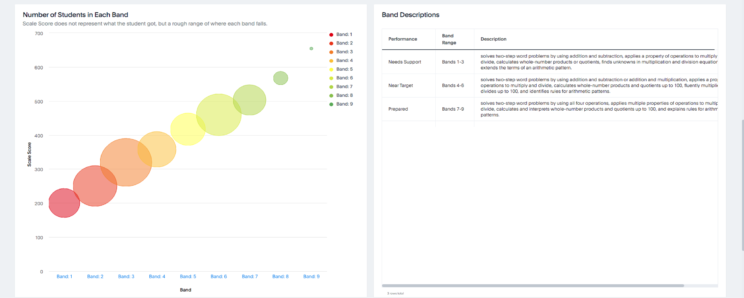
- Displays distribution of students within each band and the average scale score for the Student Group in each of the reporting categories.
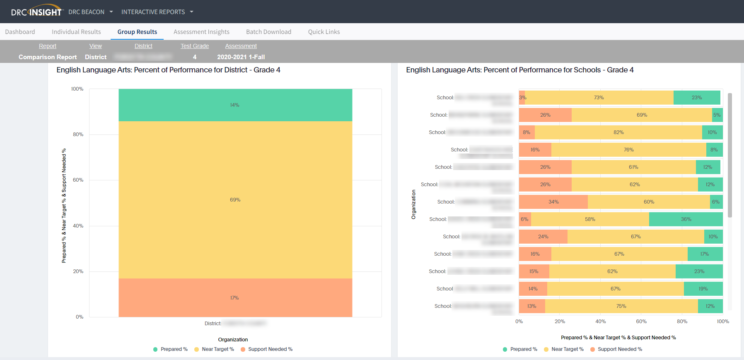
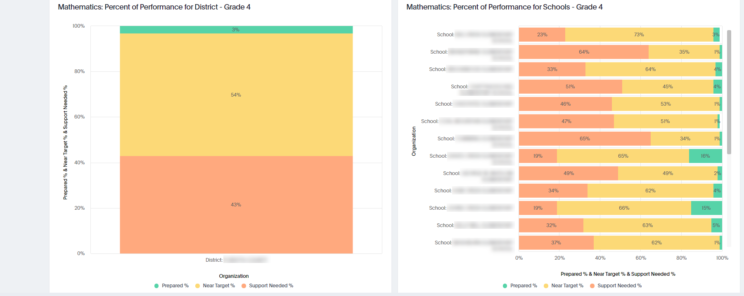
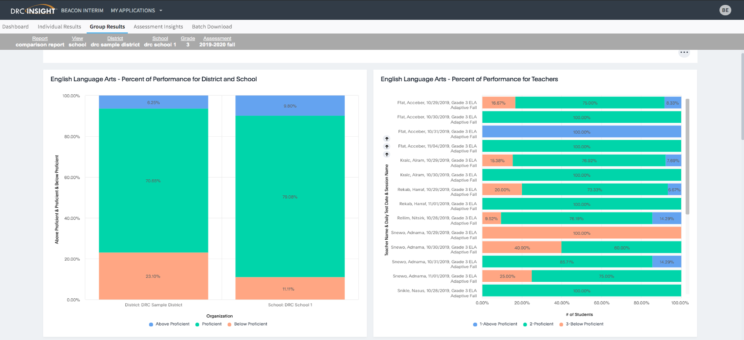
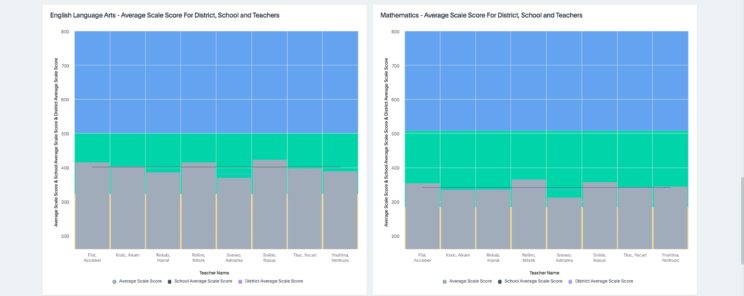
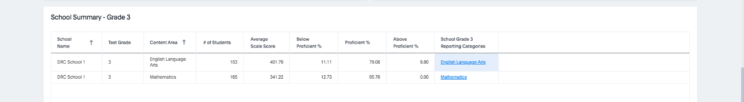
Comparison Report
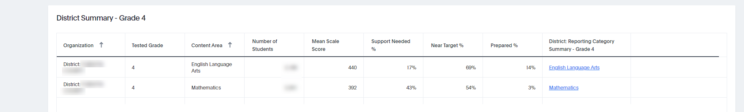
- Summary level information for a single test event
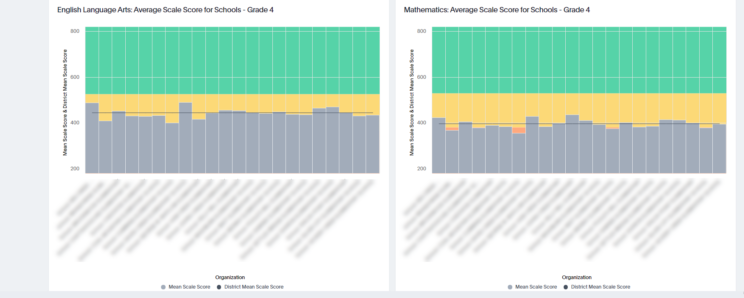
- Different charts to provide a visual representation of percent of Students within each Performance Level and comparisons to mean scores at different levels
- Includes predefined views for District, School, and Class and sections for each Content Area tested
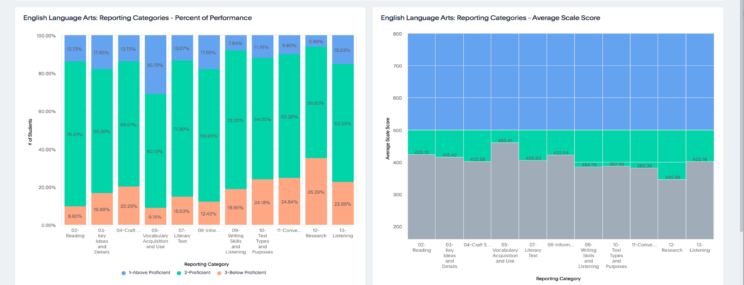
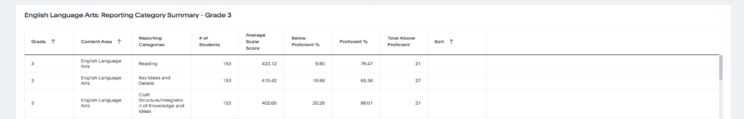
- Users (Teachers/School/District) can drill down to underlying data from the charts and link to additional views for each Reporting Category
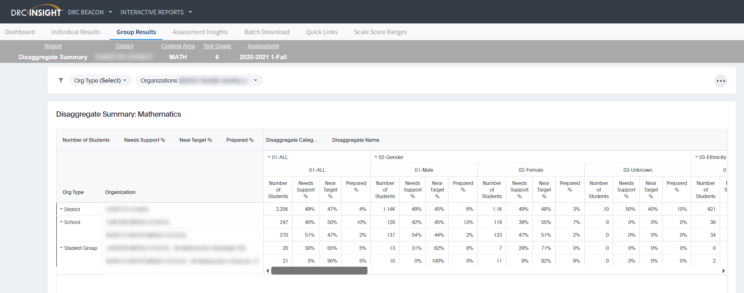
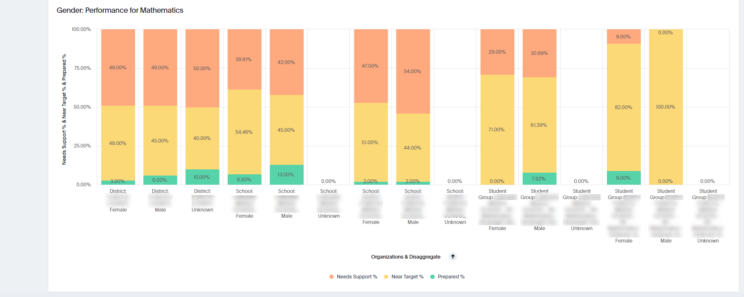
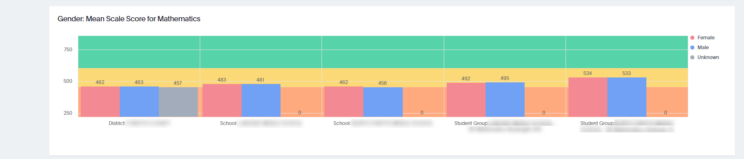
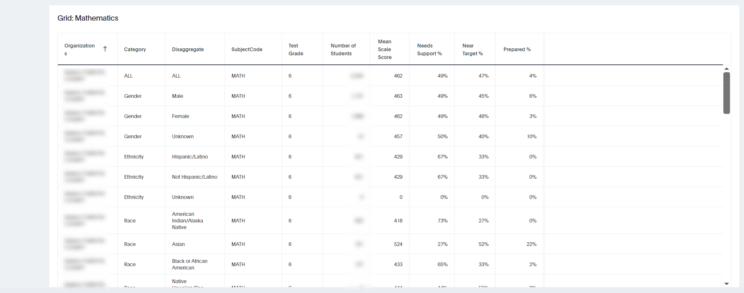
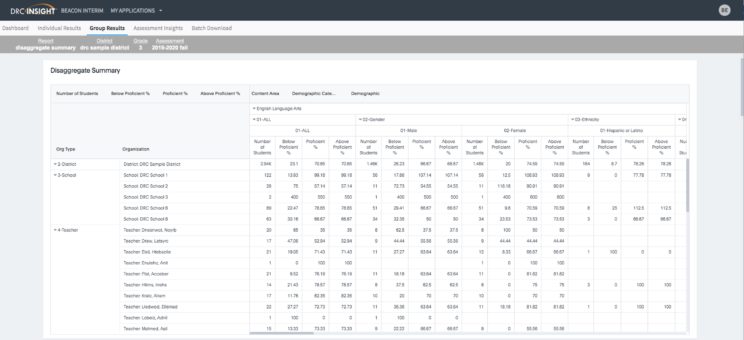
Disaggregate Summary
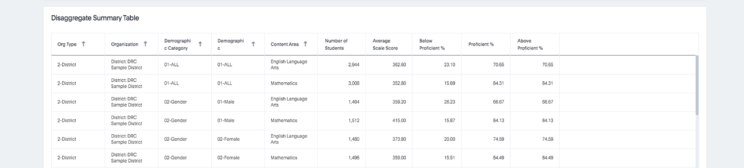
- Summary level information for a single test event
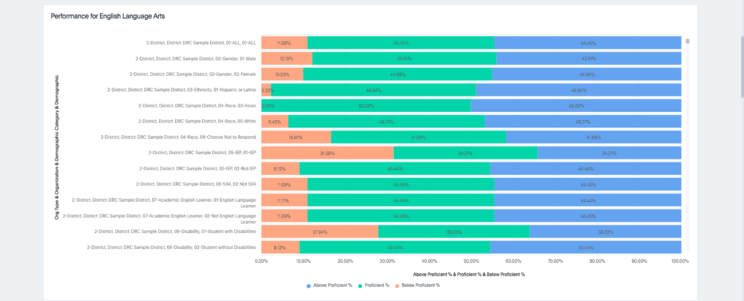
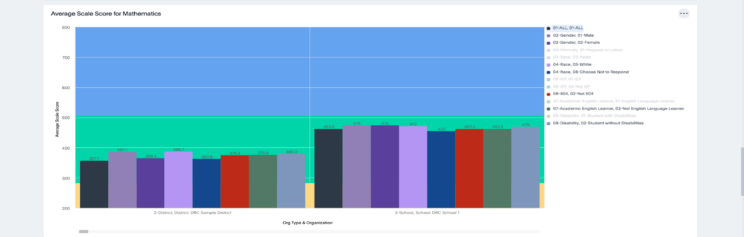
- Different charts to provide a visual representation of percent of Students within a demographic group across each Performance Level along with comparisons to mean scores at different levels
- Includes sections for each Content Area tested
- Users (Teachers/School/District) can drill down to underlying data from the charts
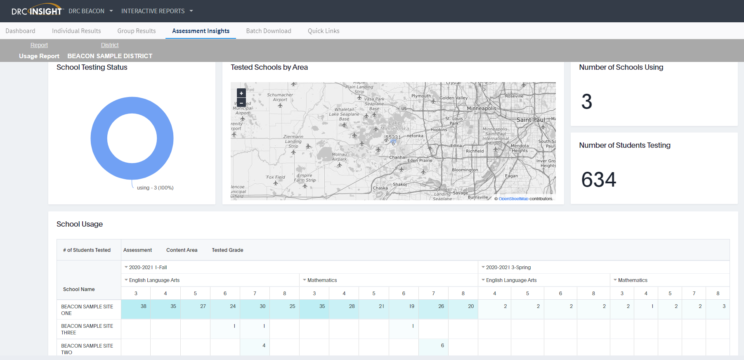
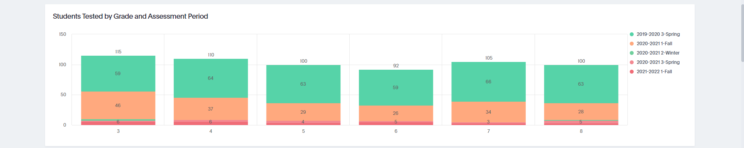
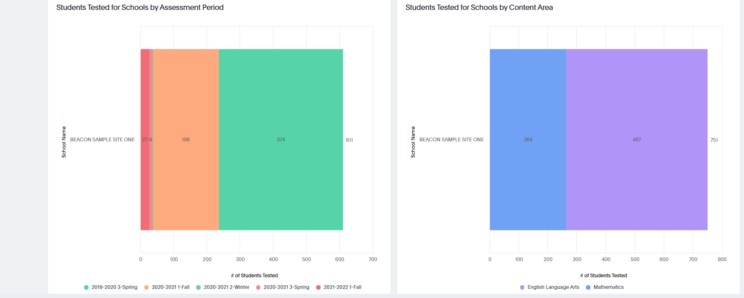
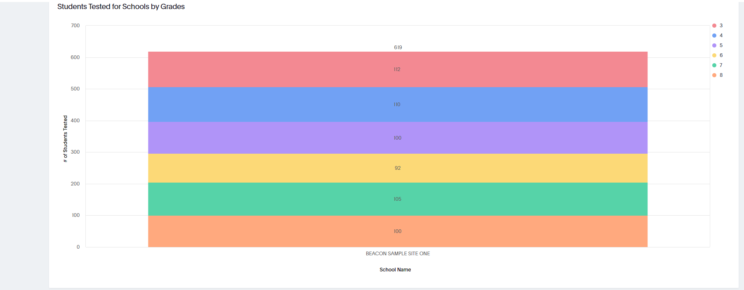
Usage Reports
- Displays testing information across a District or School
- Includes results for multiple assessment seasons
- Various charts to provide at-a-glance views of testing information
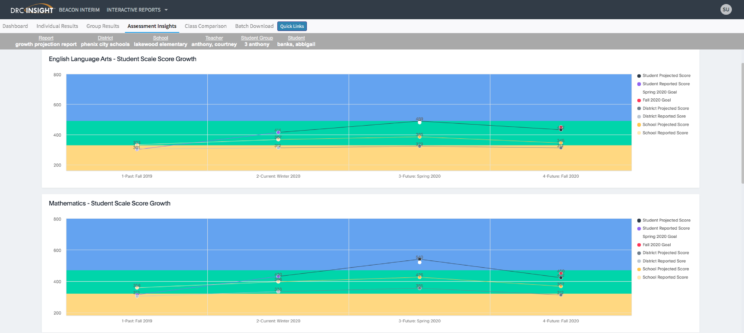
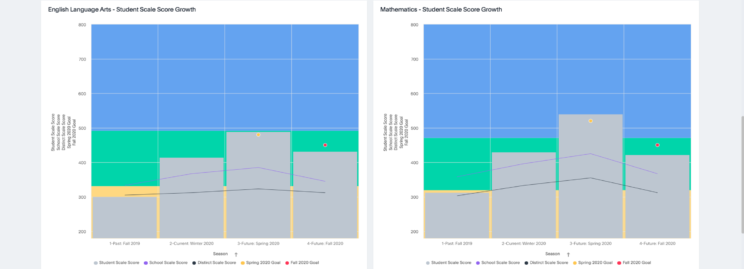
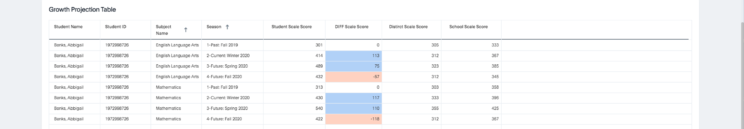
Growth Projection
- Displays all test results for a single Student at a time
- Includes actual scores for: Student; School mean; and District mean along with a Projected score for each (representing “growth”)
- Different charts representing the same baseline information to satisfy user preferences (e.g. horizontal line; vertical column; grid/table)
- Includes sections for each Content Area tested
DRC BEACON Interactive Reports Descriptions
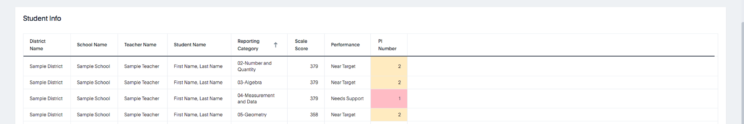
Individual Results
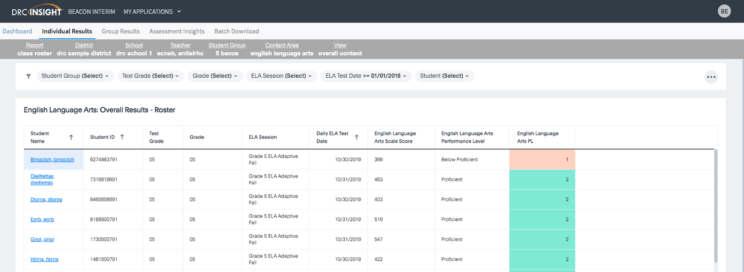
Class Roster
- List of students, some identifying elements (e.g. Student ID or DOB), and corresponding test and score information in a tabular view
- Includes results from a single test session
- Allows User (Teacher) to quickly sort Student results in a specific sequence or filter down to a subset of Students (e.g. certain performance levels or scale score ranges)
- Provides one-click access to Individual Student Reports (ISR) for viewing, download, and print. ONLY on the “All” / Overall views since the ISR will only be for complete and composite tests not individual testlets.
- Includes an option to view each content area (Math/ELA) separately or combined, along with 3 predefined views for Overall Content; Subject Area; and Reporting Category
- Choosing the Reporting Category or Subject Area view will populate another filter that allows users to select one Reporting Category/Subject Area or to go to a view with all. NOTE: when selecting the “All” view will only show Composite/Complete(Overall) tests.
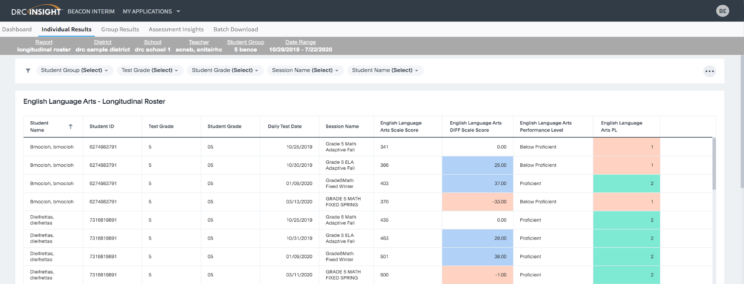
Longitudinal Roster
- List of students, some identifying elements (e.g. Student ID or DOB), and corresponding test and score information in a tabular view
- Includes results from multiple test sessions
- Allows User (Teacher) to quickly identify the change (growth or regression) in score/performance between different instructional and testing periods
- Users can sort Student results in a specific sequence or filter down to a subset of Students (e.g. certain performance levels or scale score ranges)
- Provides one-click access to Individual Student Reports (ISR) for viewing, download, and print
- Includes an option to view each content (Math/ELA) area separately or combined, and to specify a date range for relevant test sessions
Student Dashboard
- Dashboard of various measures and context related to Student testing results
- Includes all test results for a single Student at a time
- Specific views or information provided: Headline scores from most recent test event (by reporting category (Math) and Subject Area (ELA)); scale scores for all tests over time (by reporting category, Overall Content, and Subject Area(ELA)); Comparisons to mean scores for the Student Group the student was apart of for the session.
Group Results
Group Performance
- Displays scores and identifying information for a specified Student Group
- Includes results for multiple test sessions
- Different charts to provide a visual representation of Student scores and the change in scores between test events over time
- Users (All users can do this.) can select a Grade option to view the Performance Level cut points for different Grade/Content/Category combinations
- Includes an option to view each content area (Math/ELA) separately along with a predefined view for Reporting Category and a drill-down to a Summarized view of Reporting Categories to assist user on identifying which Reporting Categories to pay attention to.
Comparison Report
- Summary level information for a single test event
- Different charts to provide a visual representation of percent of Students within each Performance Level and comparisons to mean scores at different levels
- Includes predefined views for District, School, and Class and sections for each Content Area tested
- Users (Teachers/School/District) can drill down to underlying data from the charts and link to additional views for each Reporting Category
Disaggregate Summary
- Summary level information for a single test event
- Different charts to provide a visual representation of percent of Students within a demographic group across each Performance Level along with comparisons to mean scores at different levels
- Includes sections for each Content Area tested
- Users (Teachers/School/District) can drill down to underlying data from the charts
Additional Reports
Group Learning Progression
- Displays scores and identifying information for a specified Student Group
- Includes results for a single test session
- Different charts to provide a visual representation of Student scores within reach Reporting Category and corresponding Band from the Learning Progression
- Users (Teachers) can select a Grade option to view the Performance Level cut points for different Grade/Content/Category combinations
- Option to drill down to underlying data from the charts and link to the Individual Learning Progression
Individual Learning Progression
- Displays scores and identifying information for a single Student
- Includes results for a single test session
- Features tabular views of Student scores within reach Reporting Category, the corresponding Band from the Learning Progression, and the associated Standards and Descriptions
- Users (Teachers) can see the Band and Standards that align with the Student’s scores (“Tested Standards”) along with the Standards associated with the next Band(s) in the progression (“Standards for Growth”)
Growth Projection
- Displays all test results for a single Student at a time
- Includes actual scores for: Student; School mean; and District mean along with a Projected score for each (representing “growth”)
- Different charts representing the same baseline information to satisfy user preferences (e.g. horizontal line; vertical column; grid/table)
- Includes sections for each Content Area tested