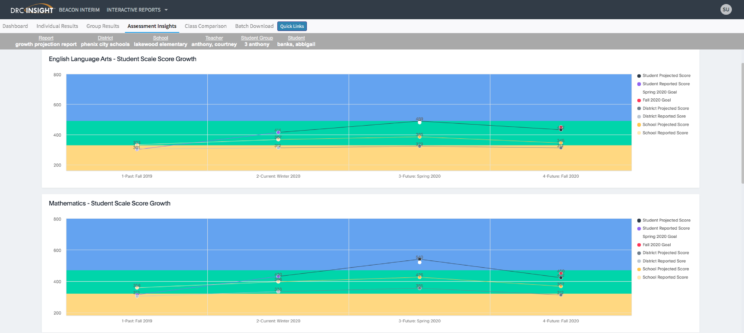
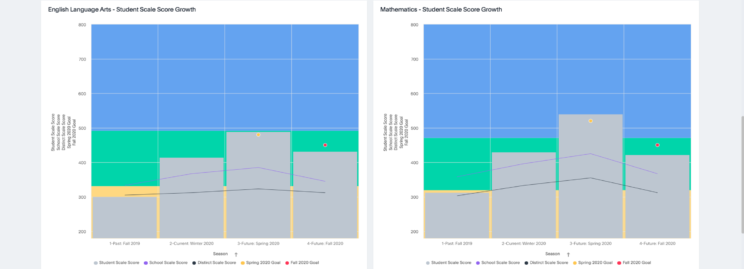
Growth Projection
- Displays all test results for a single Student at a time
- Includes actual scores for: Student; School mean; and District mean along with a Projected score for each (representing “growth”)
- Different charts representing the same baseline information to satisfy user preferences (e.g. horizontal line; vertical column; grid/table)
- Includes sections for each Content Area tested